I looked at a large number of US index based equity ETFs that are technology or general equity ETFs and selected the ones with 100 or fewer stocks to see how well they did vs the indexes such as Invesco QQQ Trust (QQQ), Vanguard S&P 500 ETF (VOO).
With fewer stocks these are likely to go up or down more when the stock market goes up or down. However, some may see this is worth the risk especially if it outperforms the market when it goes up.
iShares has new ETFs launched in 2024, iShares Nasdaq Top 30 Stocks (QTOP), iShares Top 20 U.S. Stocks ETF (TOPT) and iShares Nasdaq-100 ex Top 30 ETF (QNXT). The last one is probably the most unique because it excludes the top 30 largest companies.
Invesco NASDAQ Next Gen 100 ETF (QQQJ) which started in 2020 also excludes the largest stocks. It excludes the largest 100 companies from the Nasdaq so selects 200-300 largest companies instead.
The smallest number of stocks is iShares Top 20 U.S. Stocks ETF (TOPT) which has only 21 stocks at the time of this writing.
The largest ETFs by market cap is Invesco QQQ Trust (QQQ) which has about $288 billion in assets. The Technology Select Sector SPDR Fund (XLK)is second with around $72B. The ones with the least amount of assets so far are the brand new ones such as iShares Nasdaq-100 ex Top 30 ETF (QNXT) which only has $15M.
The strangest one is the Sofi Social 50 (XNTK). It only invests in the most popularly held stocks by Sofi Invest users and is also adjusted monthly which is unusual. The performance recently has been good but they are still failing to bring in large amounts of money at only $20M which isn’t very much for an ETF.
The most boring ones are probably the Dow Jones Industrial Average based ones which have sort of under performed the S&P 500. Out of all of them, the Schwab U.S. Dividend Equity ETF (SCHD) pays the most dividend with a 4.03% dividend yield while still being fairly well performing for the group. SCHD is also has the lowest expense ratio at .06% vs .60% for the highest one, Invesco Dorsey Wright Technology Momentum ETF (PTF).
There are more ETFs that have less than 100 stocks but many are sector specific or are really small (low assets) or have higher fees so I excluded those.
The top performers for the last 5 years were the ETFs with the most tech such as PTF (100%) XLK (100%), XNTK (72%), and MGK (61%). QQQ (59%) is not far behind. The 5 year performance was pretty much in that order based on the tech percentage.
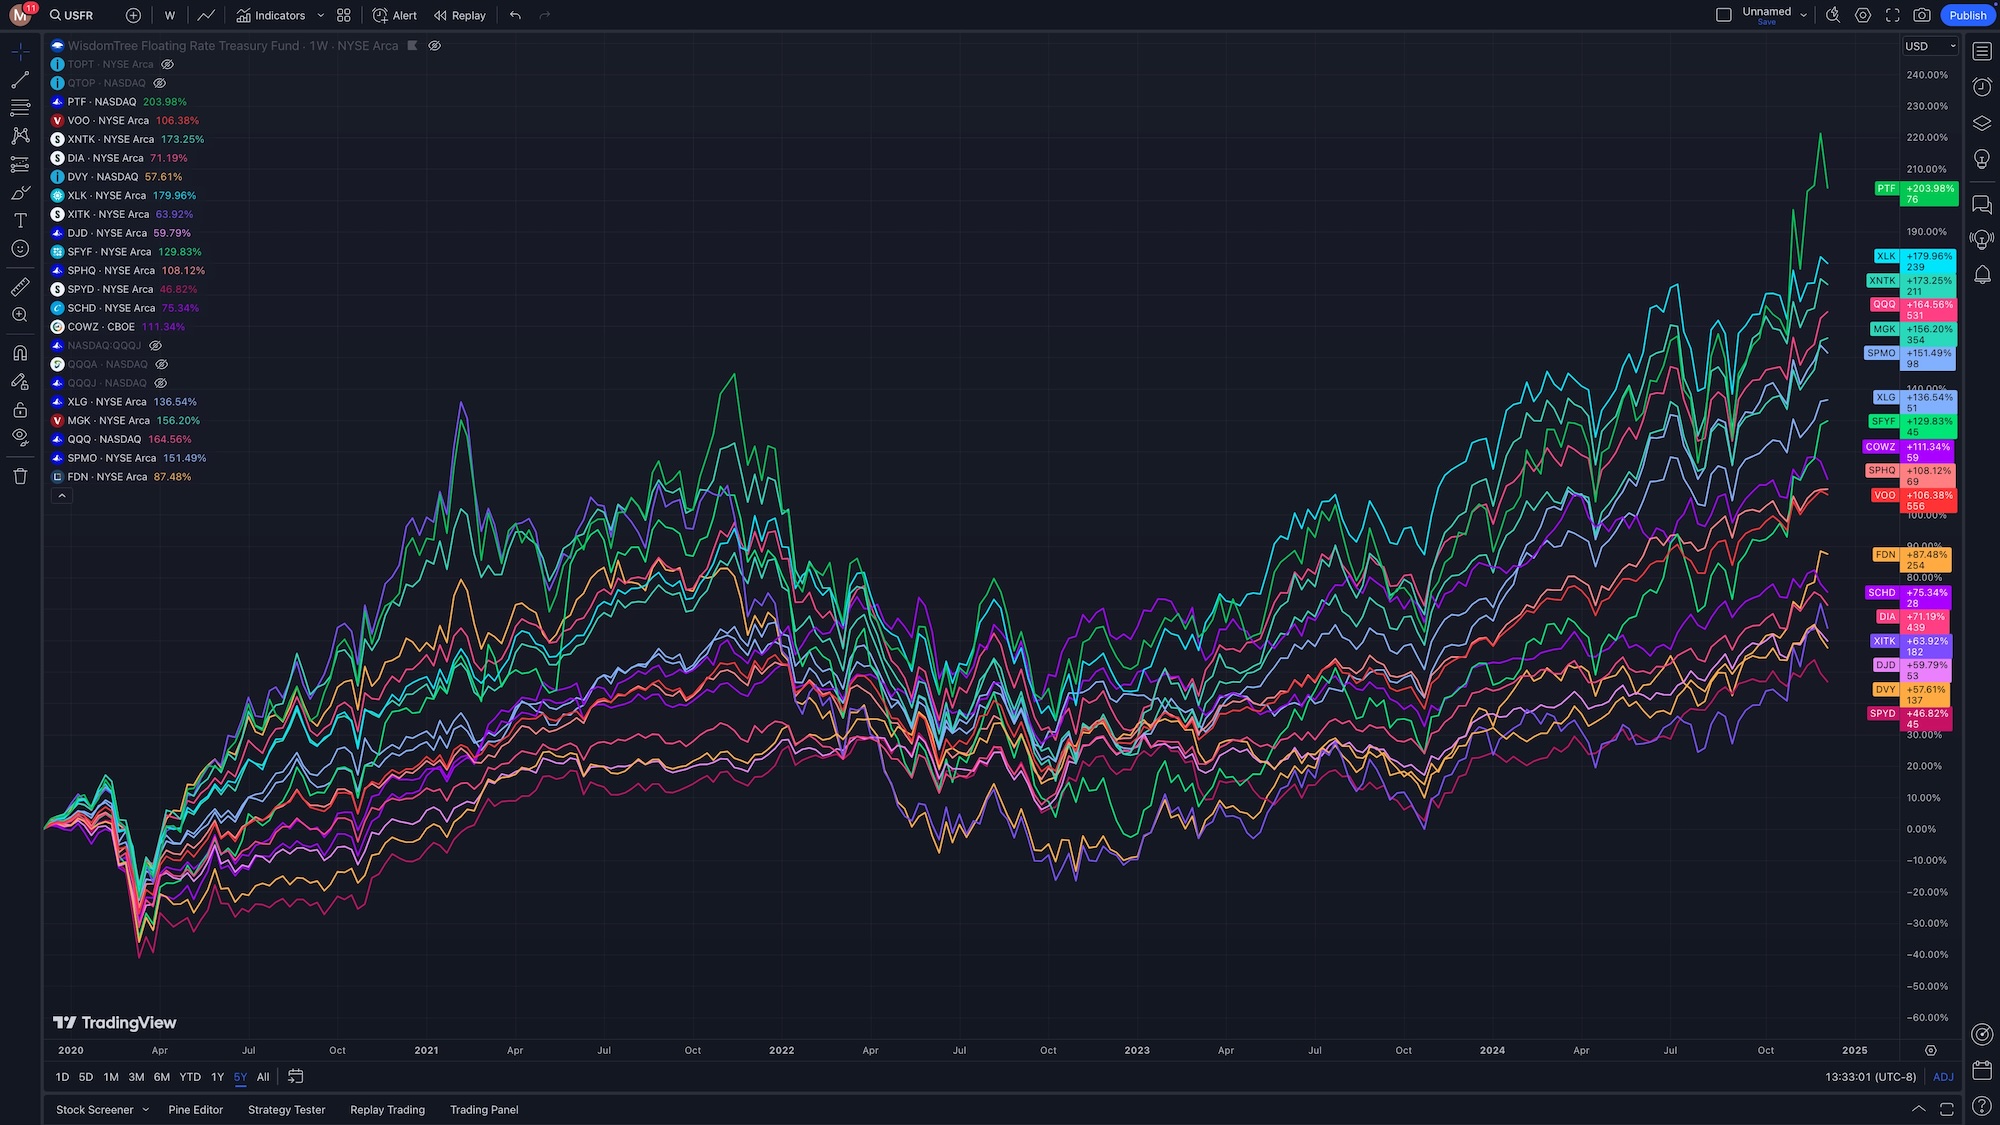
Another 100% tech one is the XITK SPDR FactSet Innovative Technology ETF. Although it has 100% in tech the performance was not as good as the others that hold the usual large cap stocks. XITK holds an unusual mix of stocks.
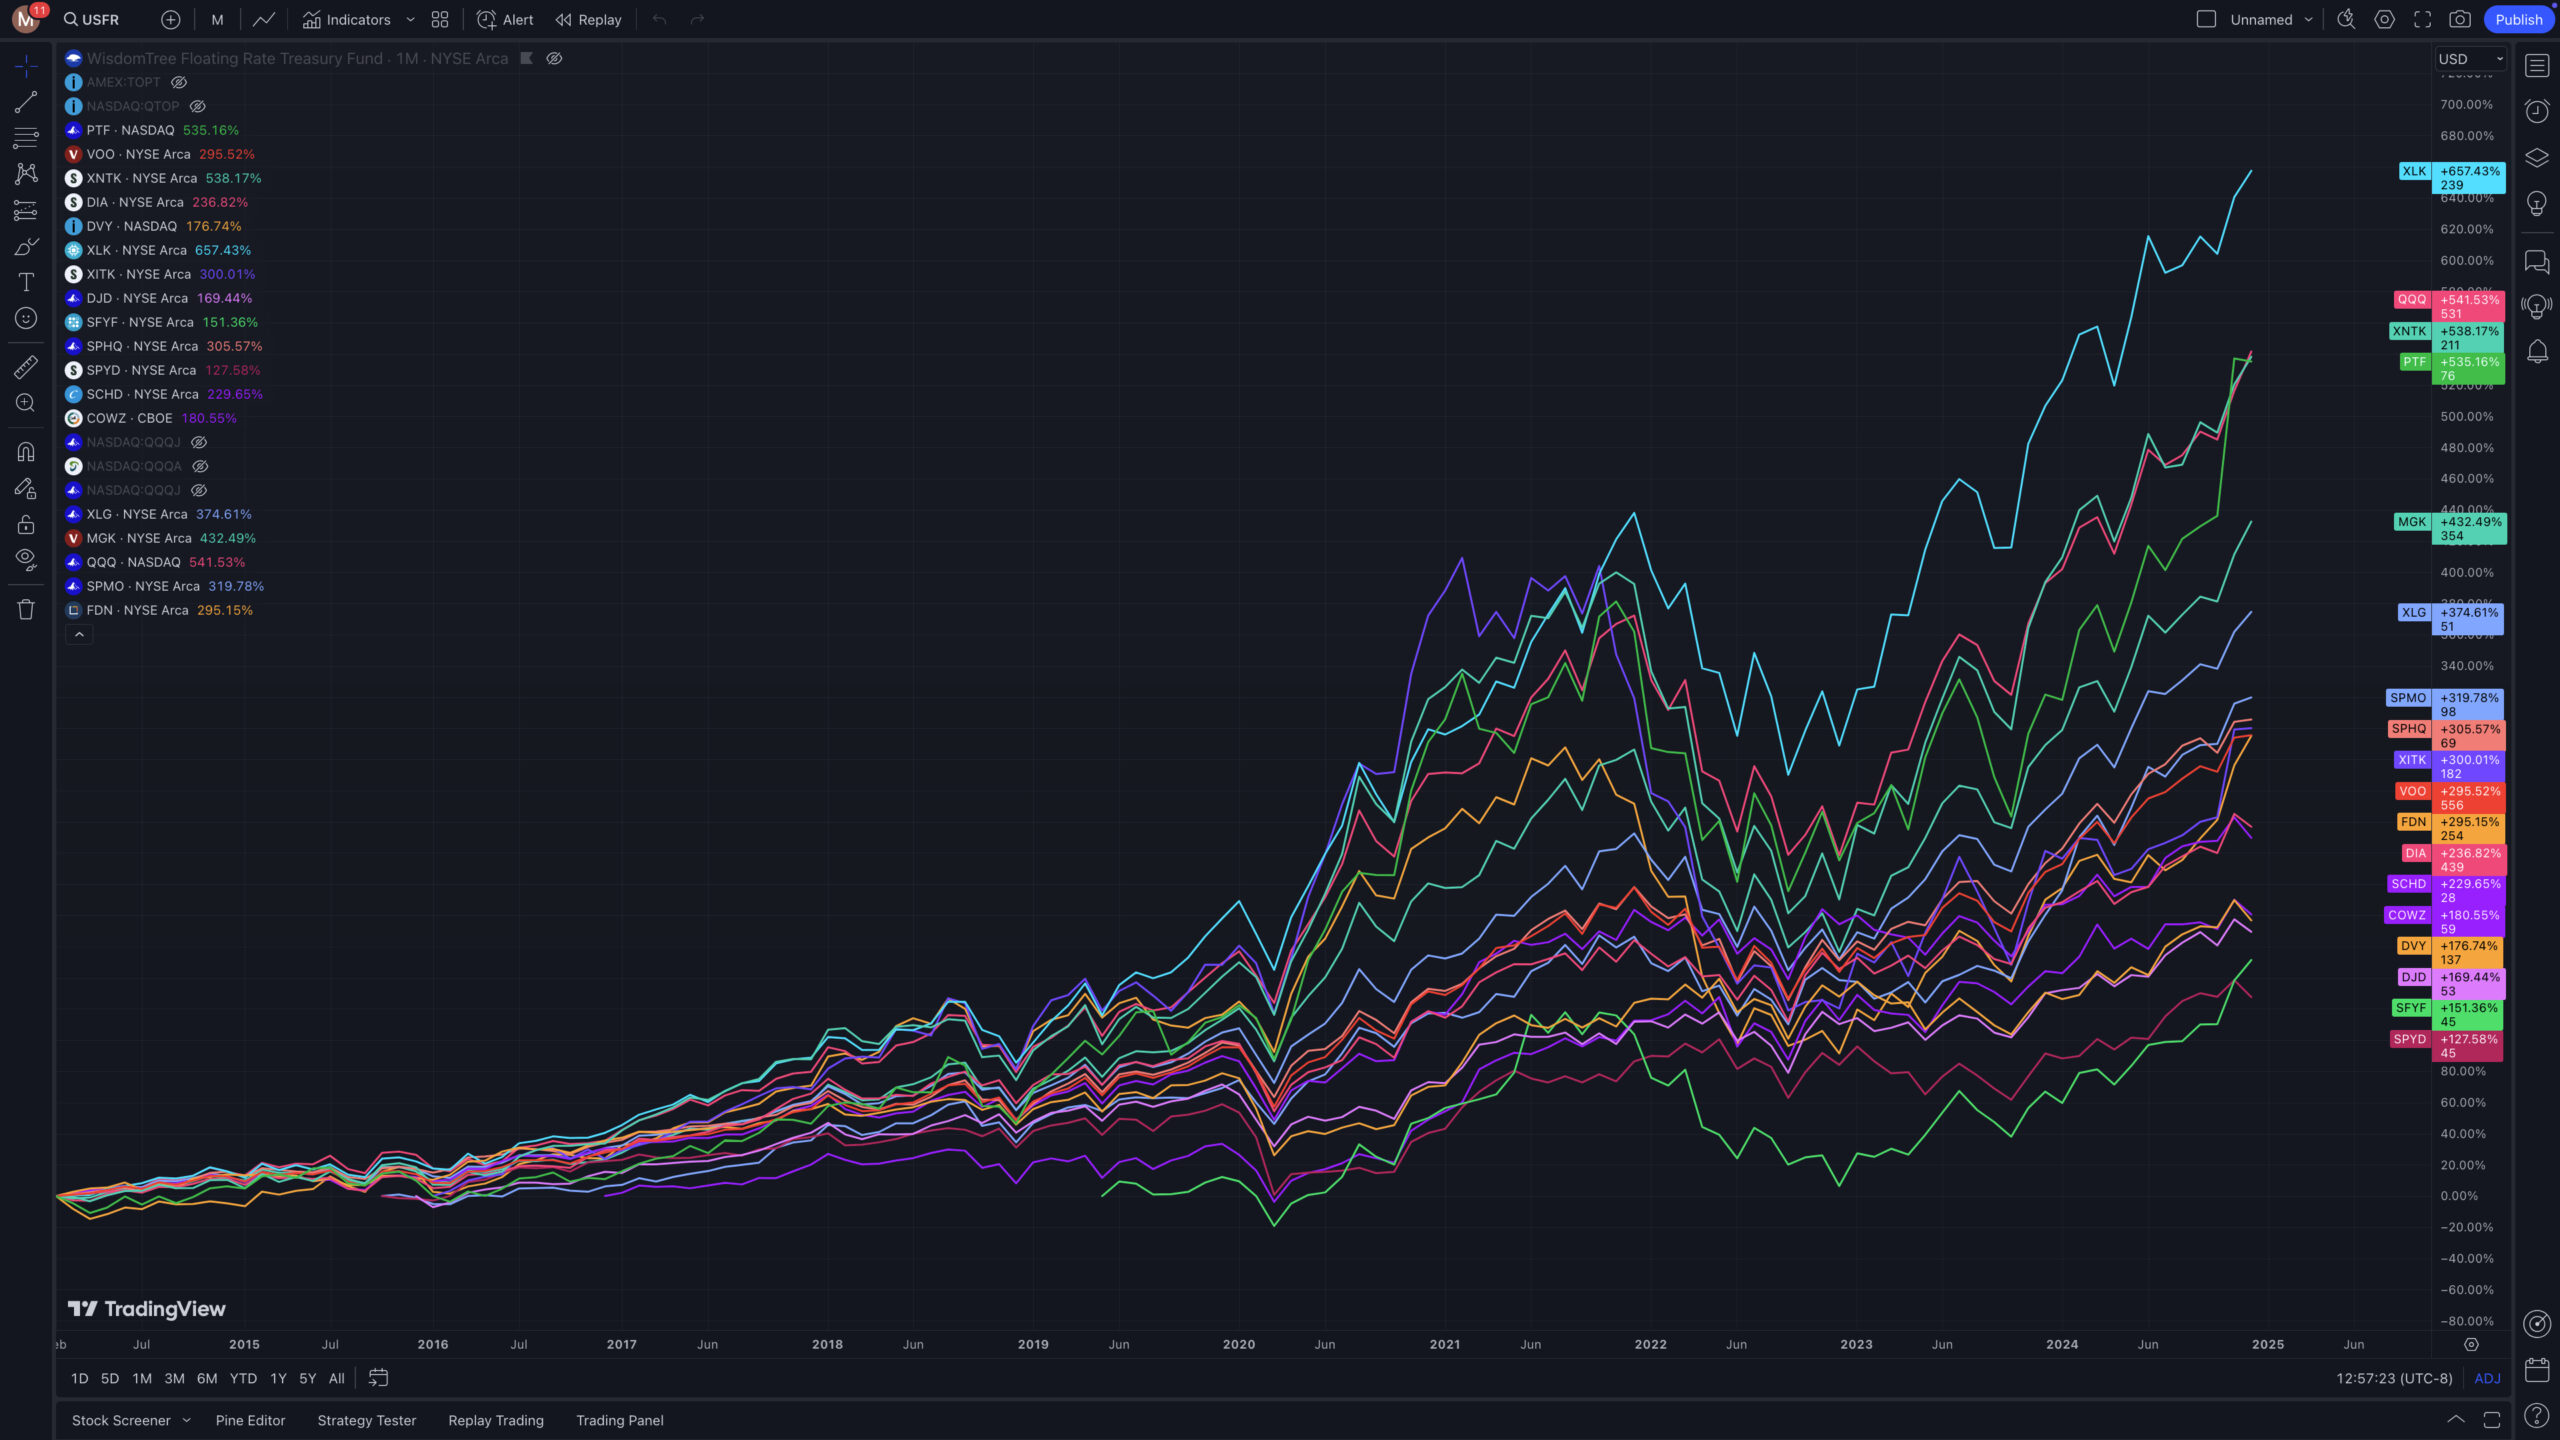
The 10 year performance was more of the same. Tech is still the winner and all of the same ETFs are still in the list with QQQ (59%) jumping up even higher as shown in red. The benchmark Vanguard S&P 500 (VOO) with 500 stocks and 31% tech falls slightly in the middle and COWZ beat VOO slightly even with only 21% tech.
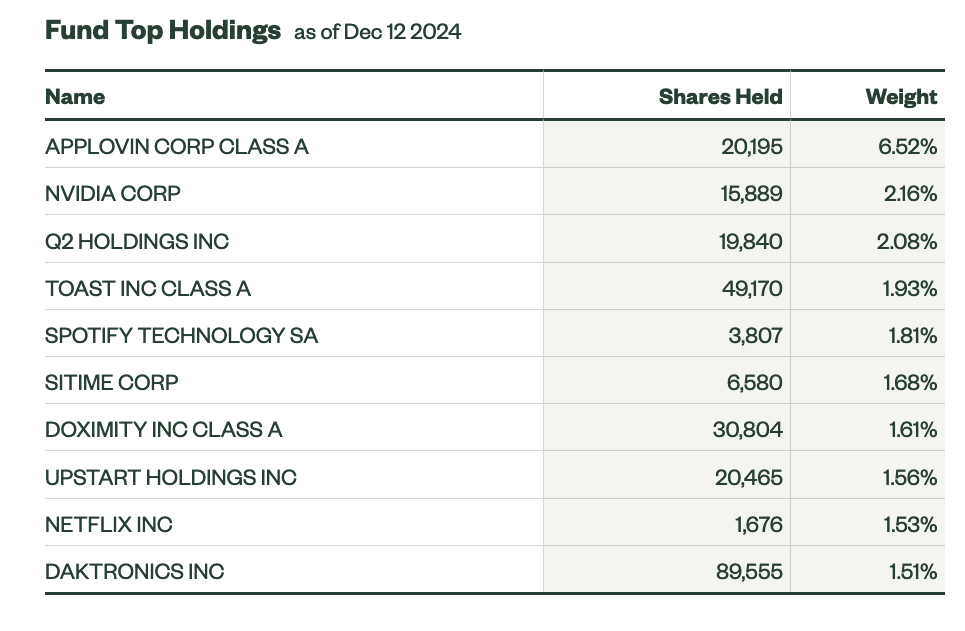
FDN despite having 39% tech which is greater than VOO (31%) trailed the Vanguard S&P 500 VOO slightly at 87% vs 106% return. FDN has a very high .50% fee which probably contributes to this.
DJIA and Dividend ETFS
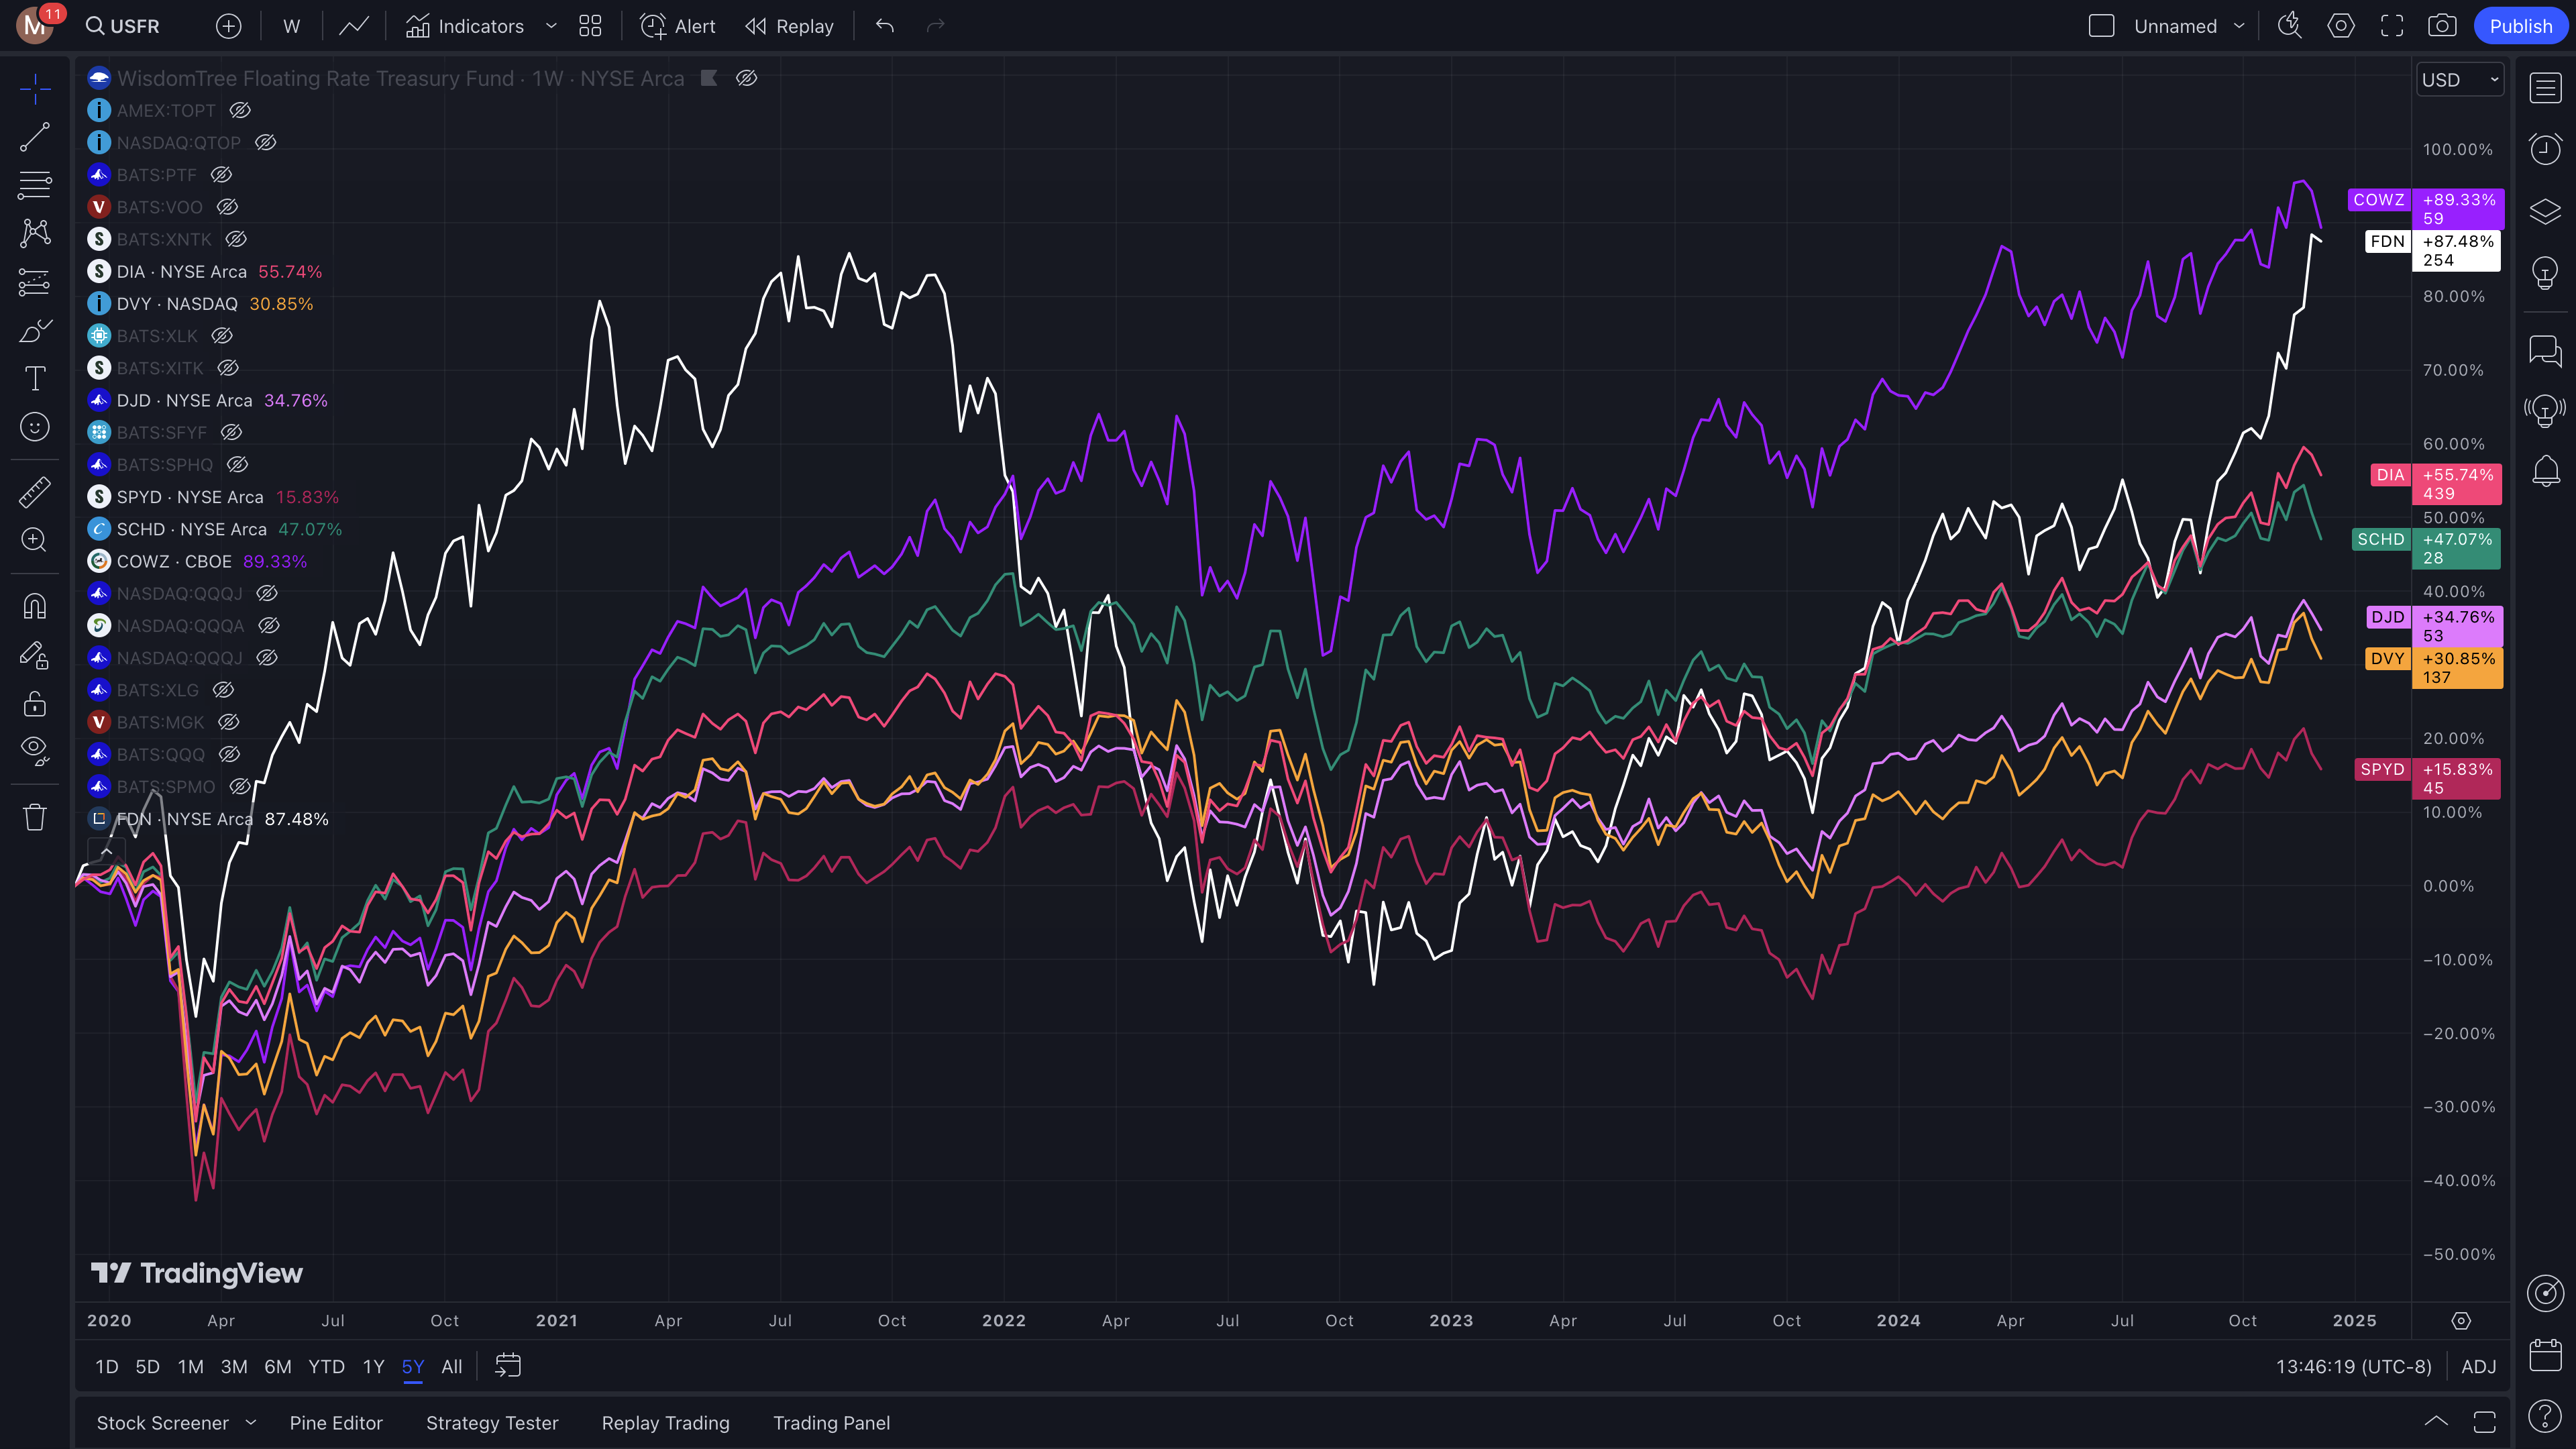
After removing all of these tech heavy ETFs and comparing the DJIA and Dividend ETFs for the 5 year we see that it is pretty much more of the same with the heaviest tech percentages leading the 5 year returns: Pacer US Cash Cows 100 COWZ (21%) First Trust Dow Jones Internet Index FND (37%), SPDR Dow Jones DIA (20%). However, coming in second to third most of the time is Charles Schwab US Dividend Equity ETF SCHD (9%). This one is a bit unusual because it has one of the highest dividend yields also at 4.03%. When turning off dividend reinvestment it still stays about in the same second to third place.
The 10 year return is shown below.
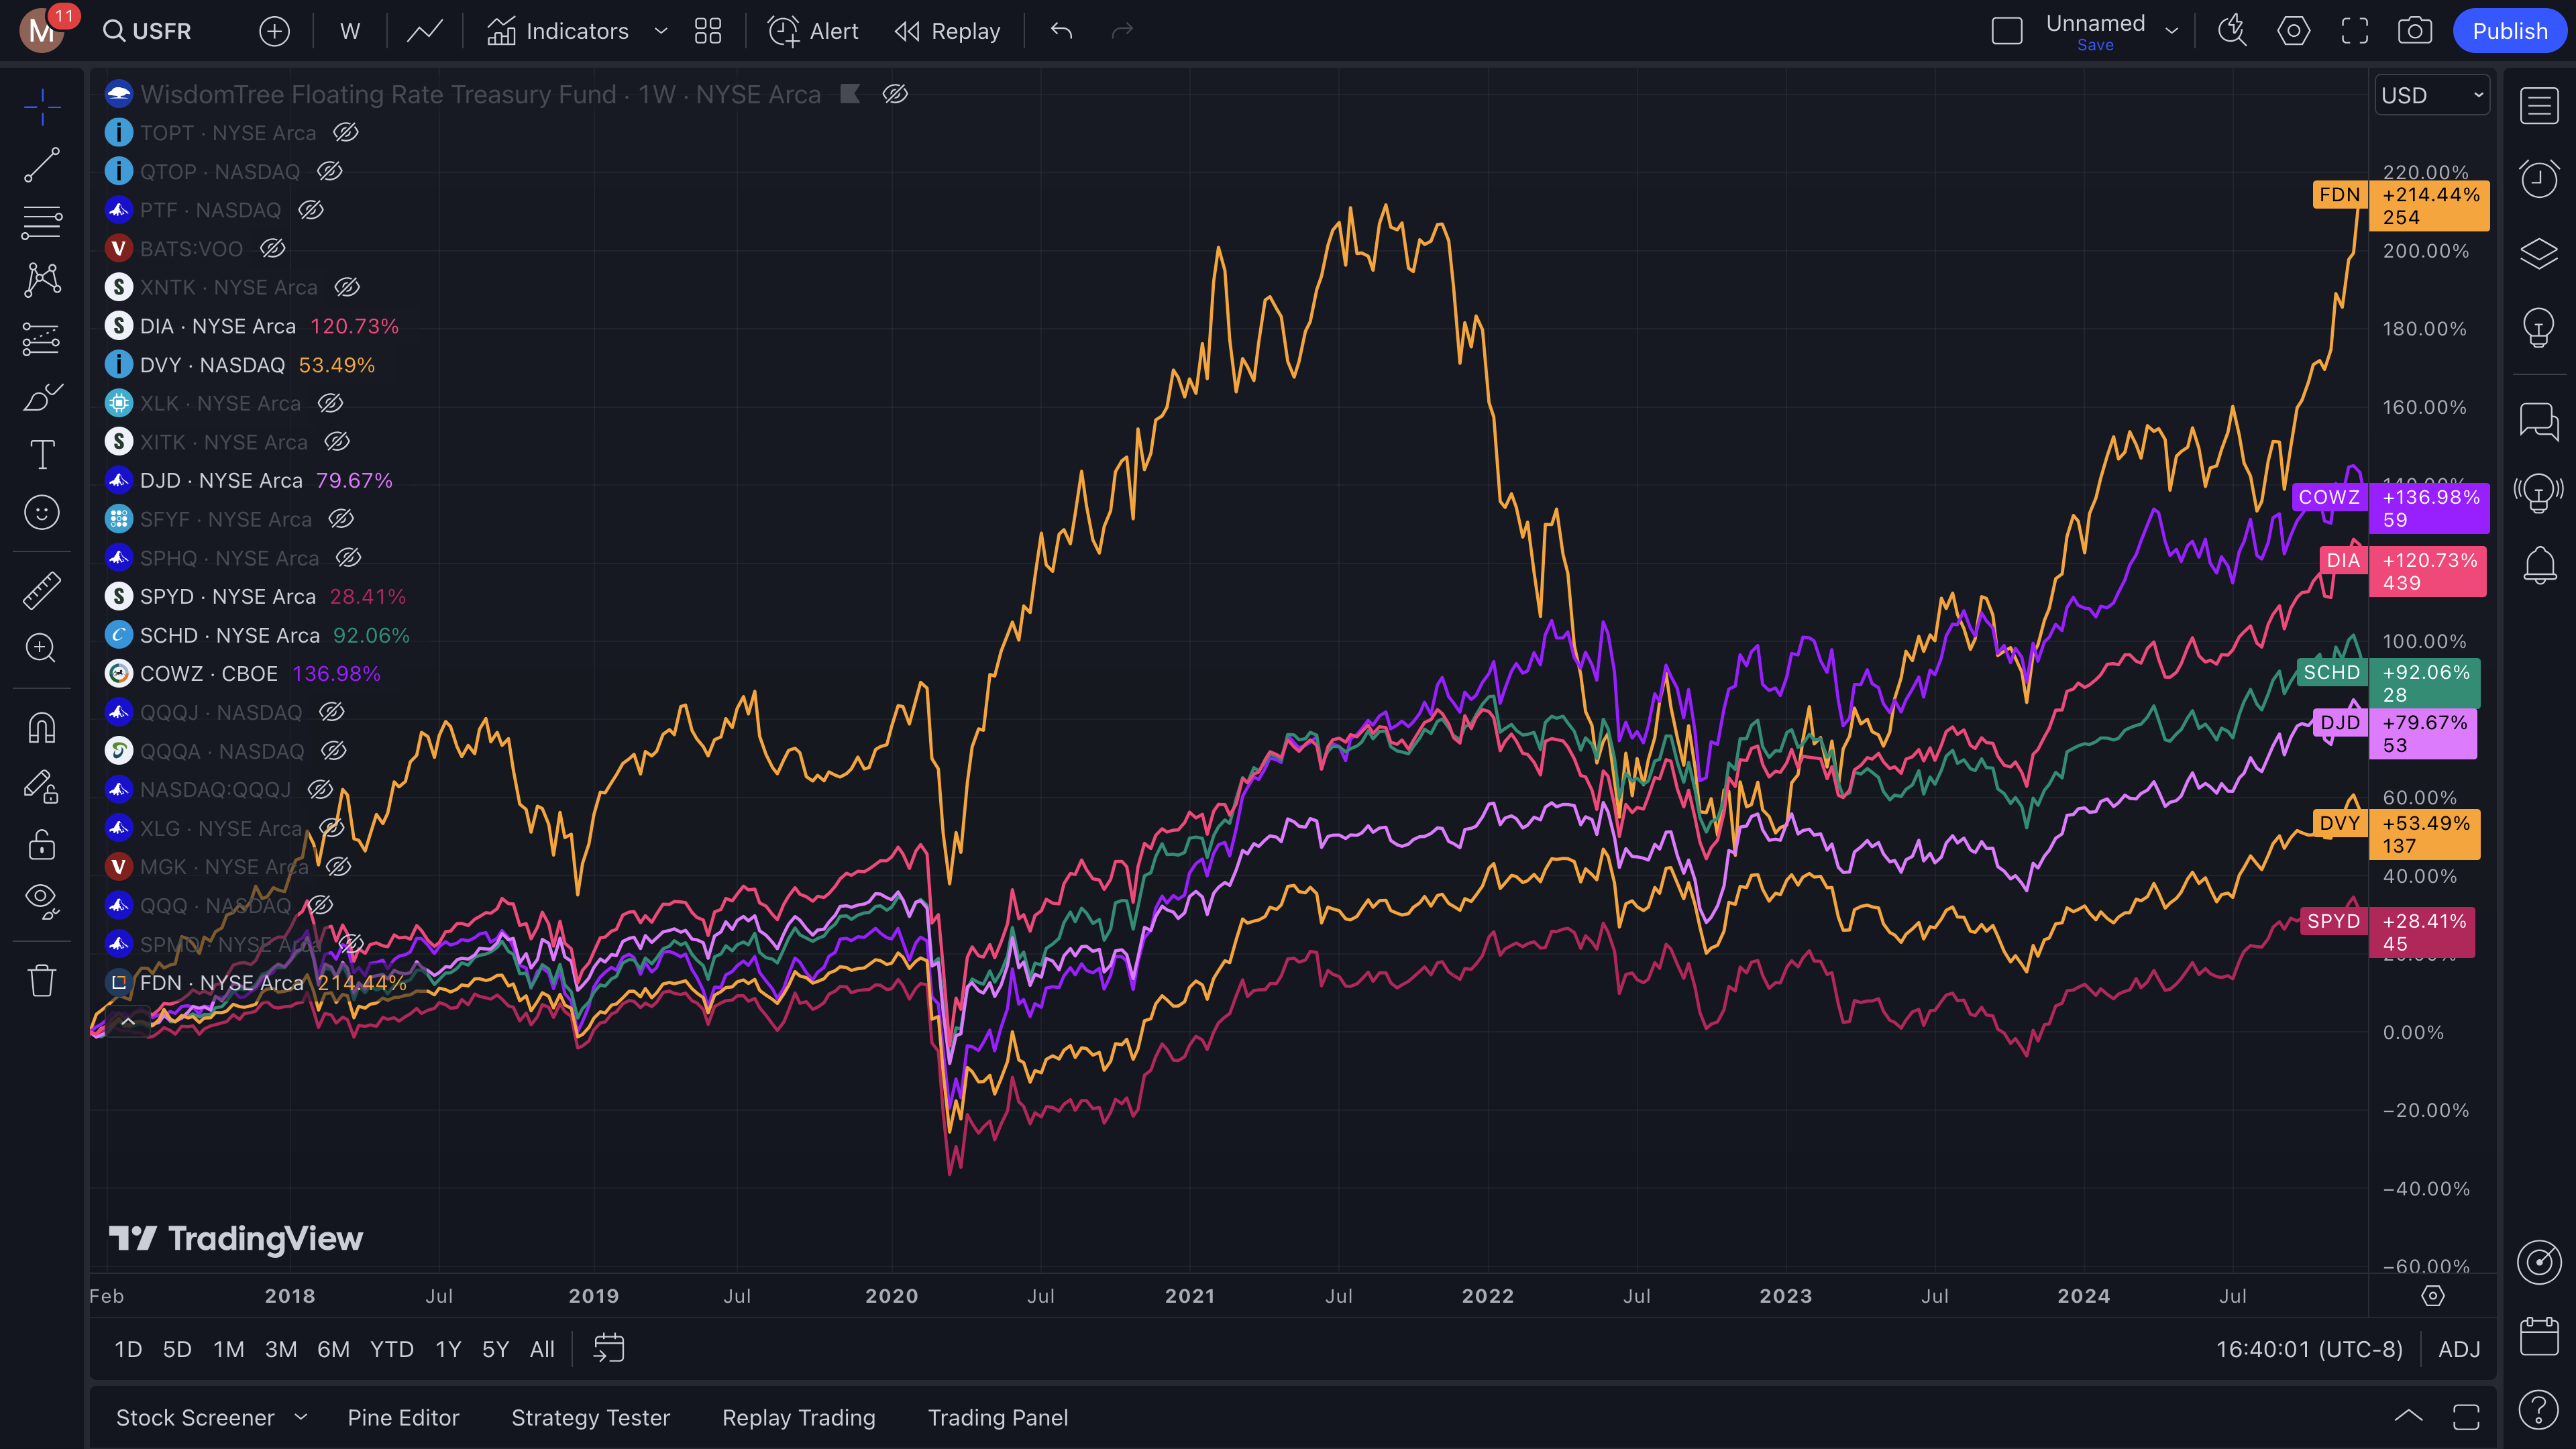
FDN which has 37% tech, the highest in the group was the #1 performer from 12/16/2016 till 12/9/2024. This eight year period was used instead of ten years because COWZ started then. FDN, COWZ, DIA and SCHD were the top performers while DVY and SPYD were the worst performers. DVY and SPYD both have the least amount of tech at 3% and 8% respectively.
NASDAQ based ETFS
Many of these ETFs are brand new so couldn’t be compared and so I used a 4 yr time period from the date that QQQA was started in 2021.
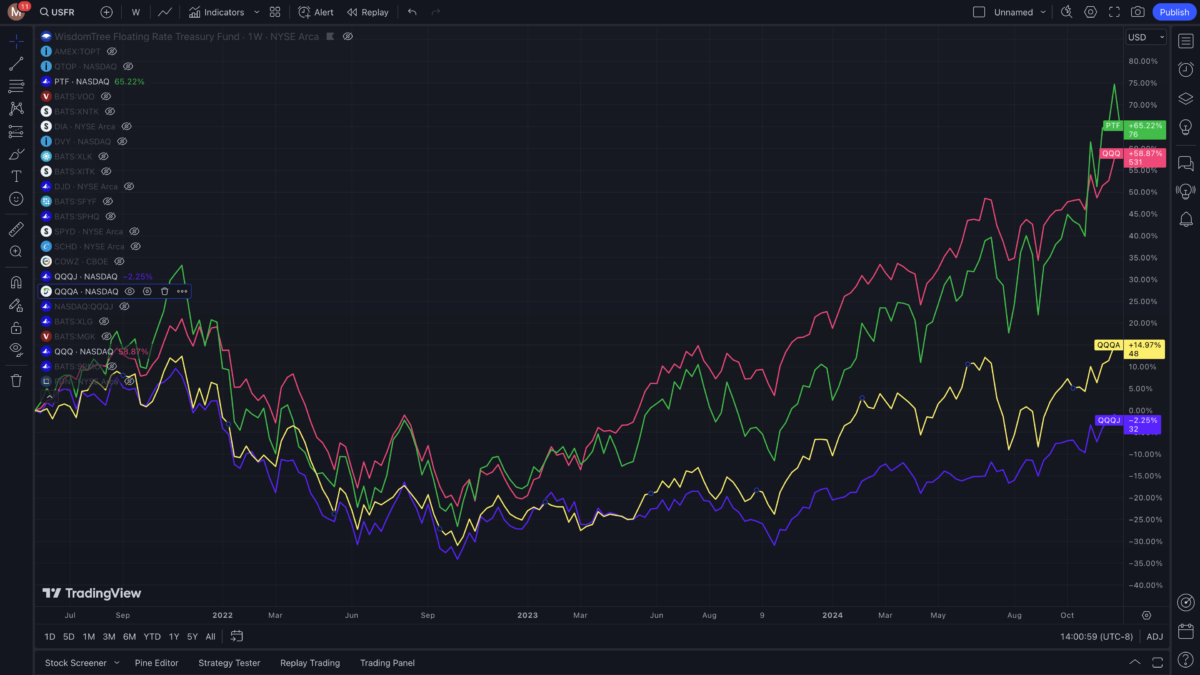
The performance winners for this time period are yet again the ETFs with the most percentage invested in technology. PTF (100%), QQQ (59%) and QQQA (47%).
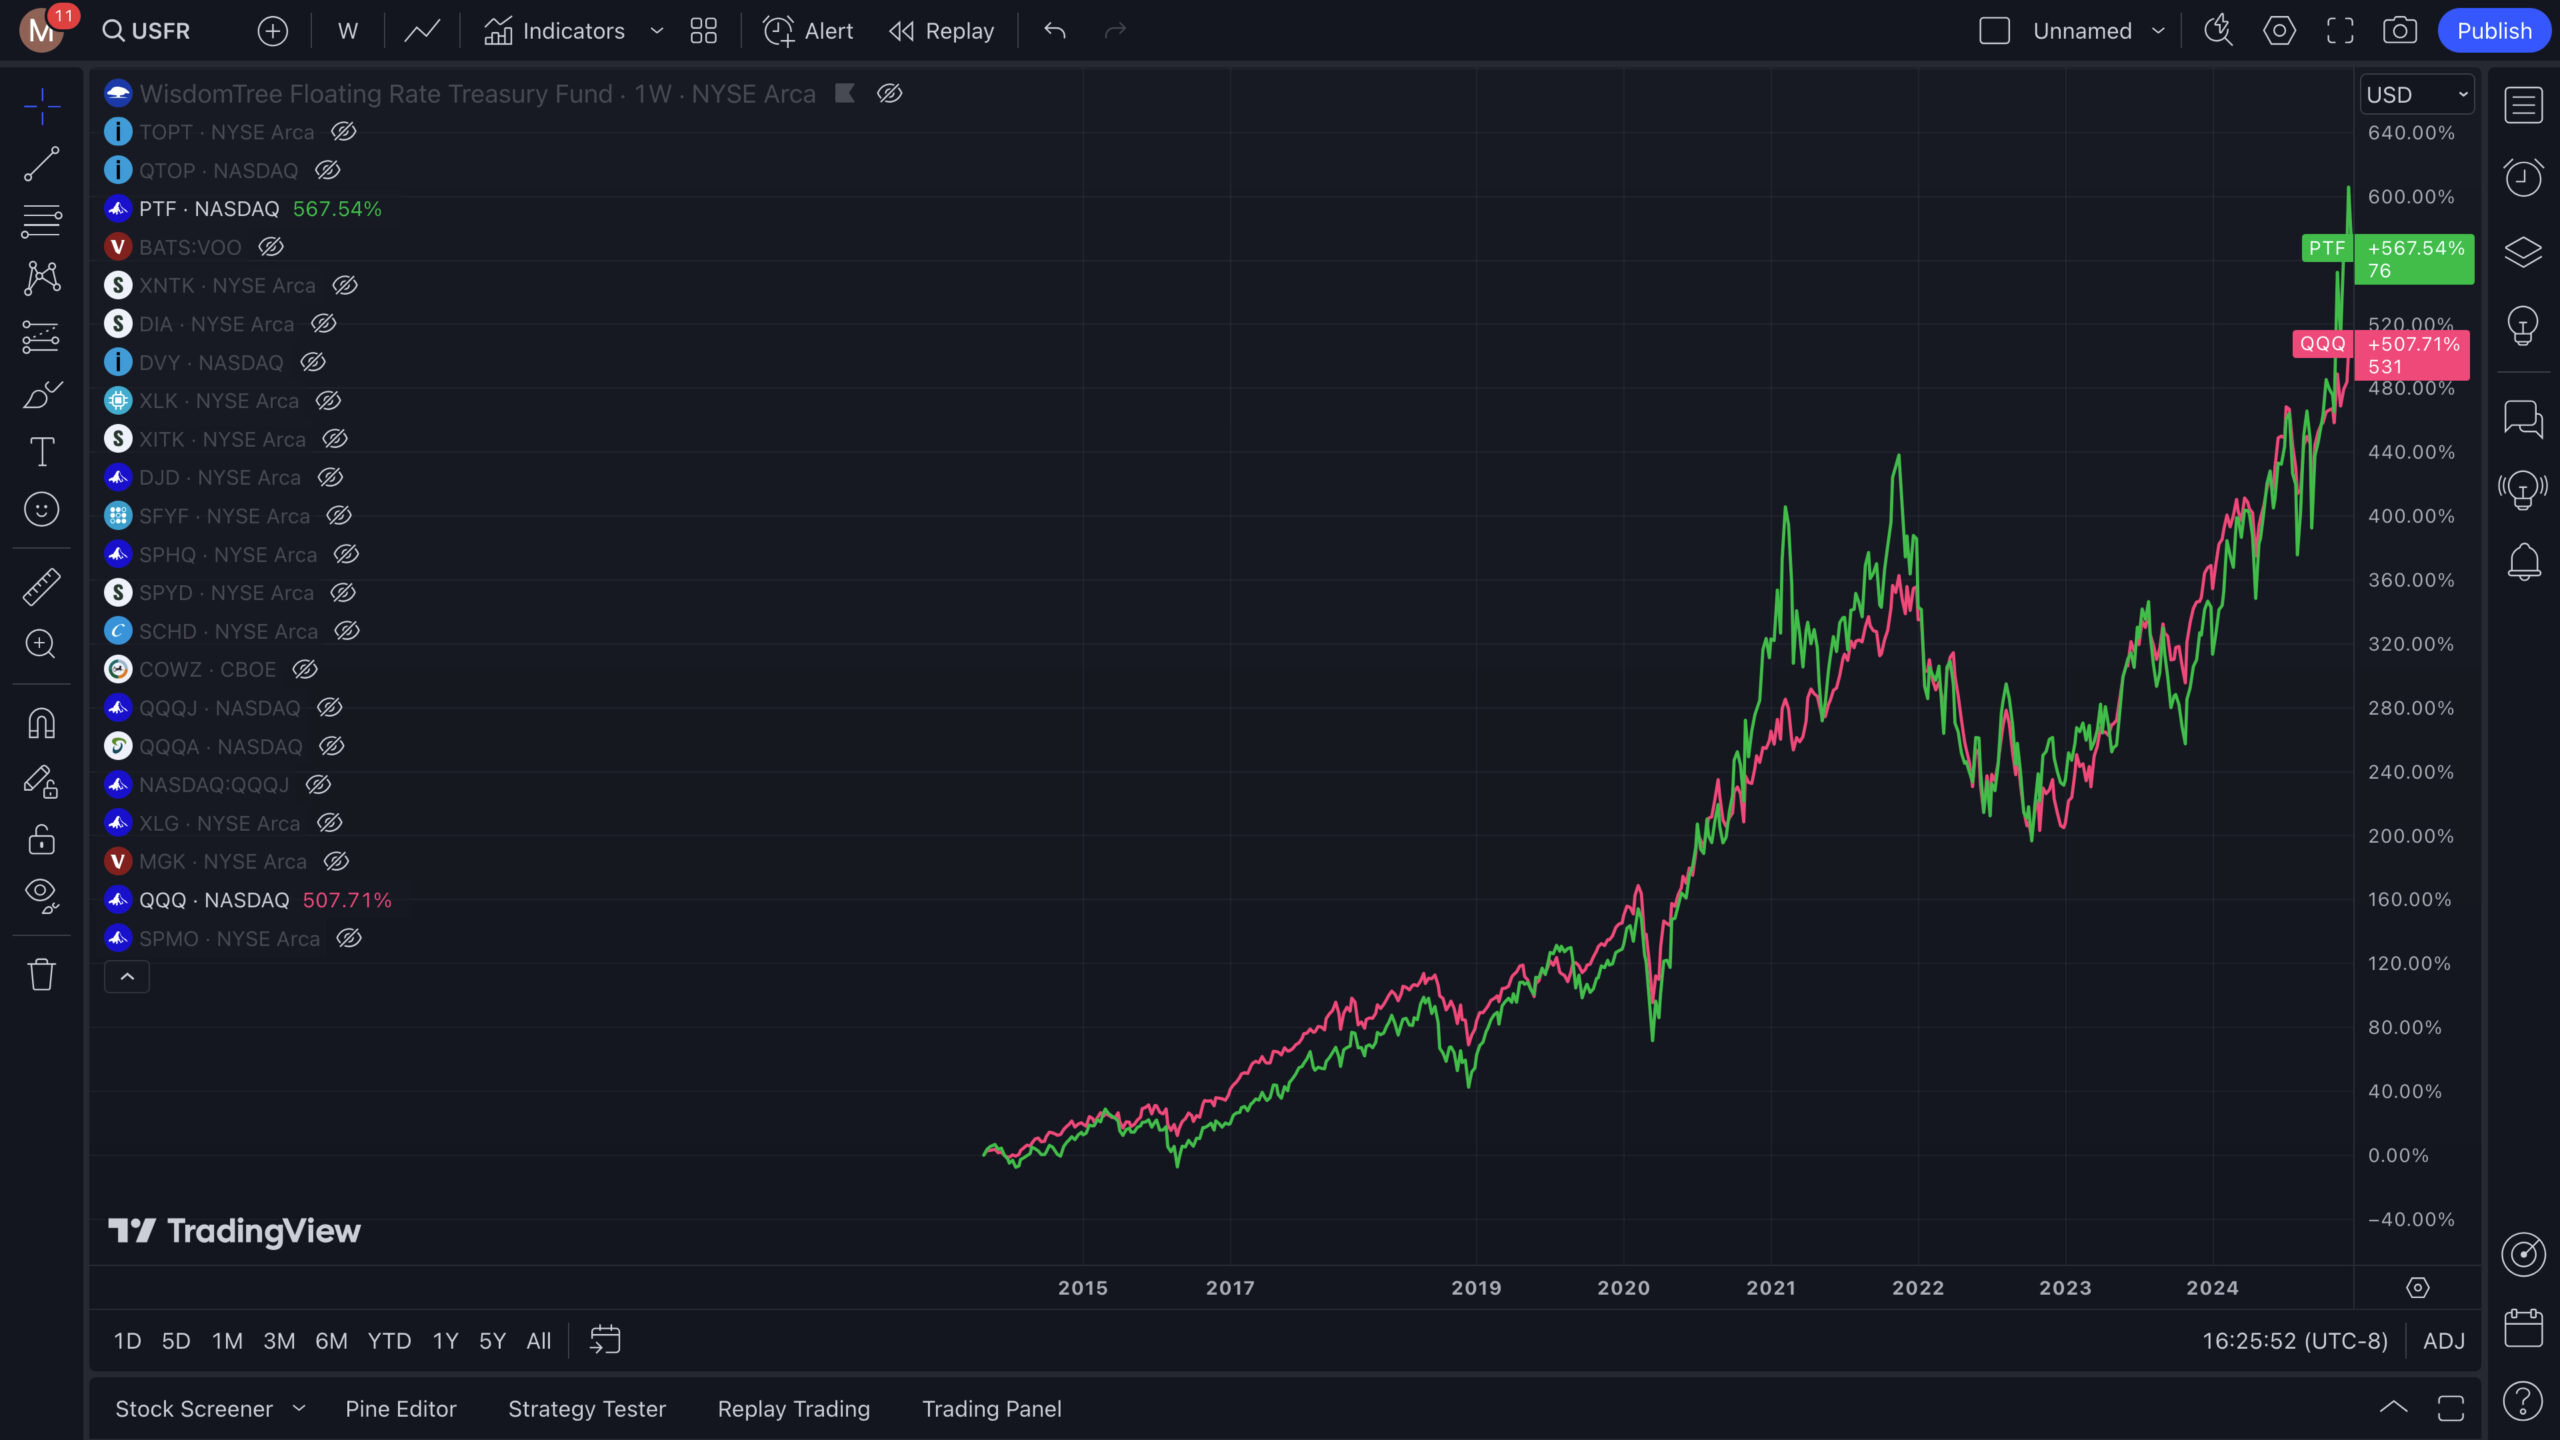
The 10 year performance is show in the chart below. There were only two ETFs that have been around for 10 years that is why there isn’t much to look at. PTF did very well and QQQ as well.
Other ETFs
The 5 year performance worst performance is a toss up between S&P 500 Quality Index SPHQ (33%) and XITK (100%). The Technology Select Sector SPDR Fund (XLK) (100%), SPDR NYSE Technology (XNTK) (72%), Vanguard Mega Cap Growth (MGK) (61%) and surprisingly S&P 500 Momentum Index (SPMO) (39%) were the top performers. SPMO has the second least amount of tech at 39% which did well considering this. However, it was neck and neck with XLG which has has 42% tech until just recently.
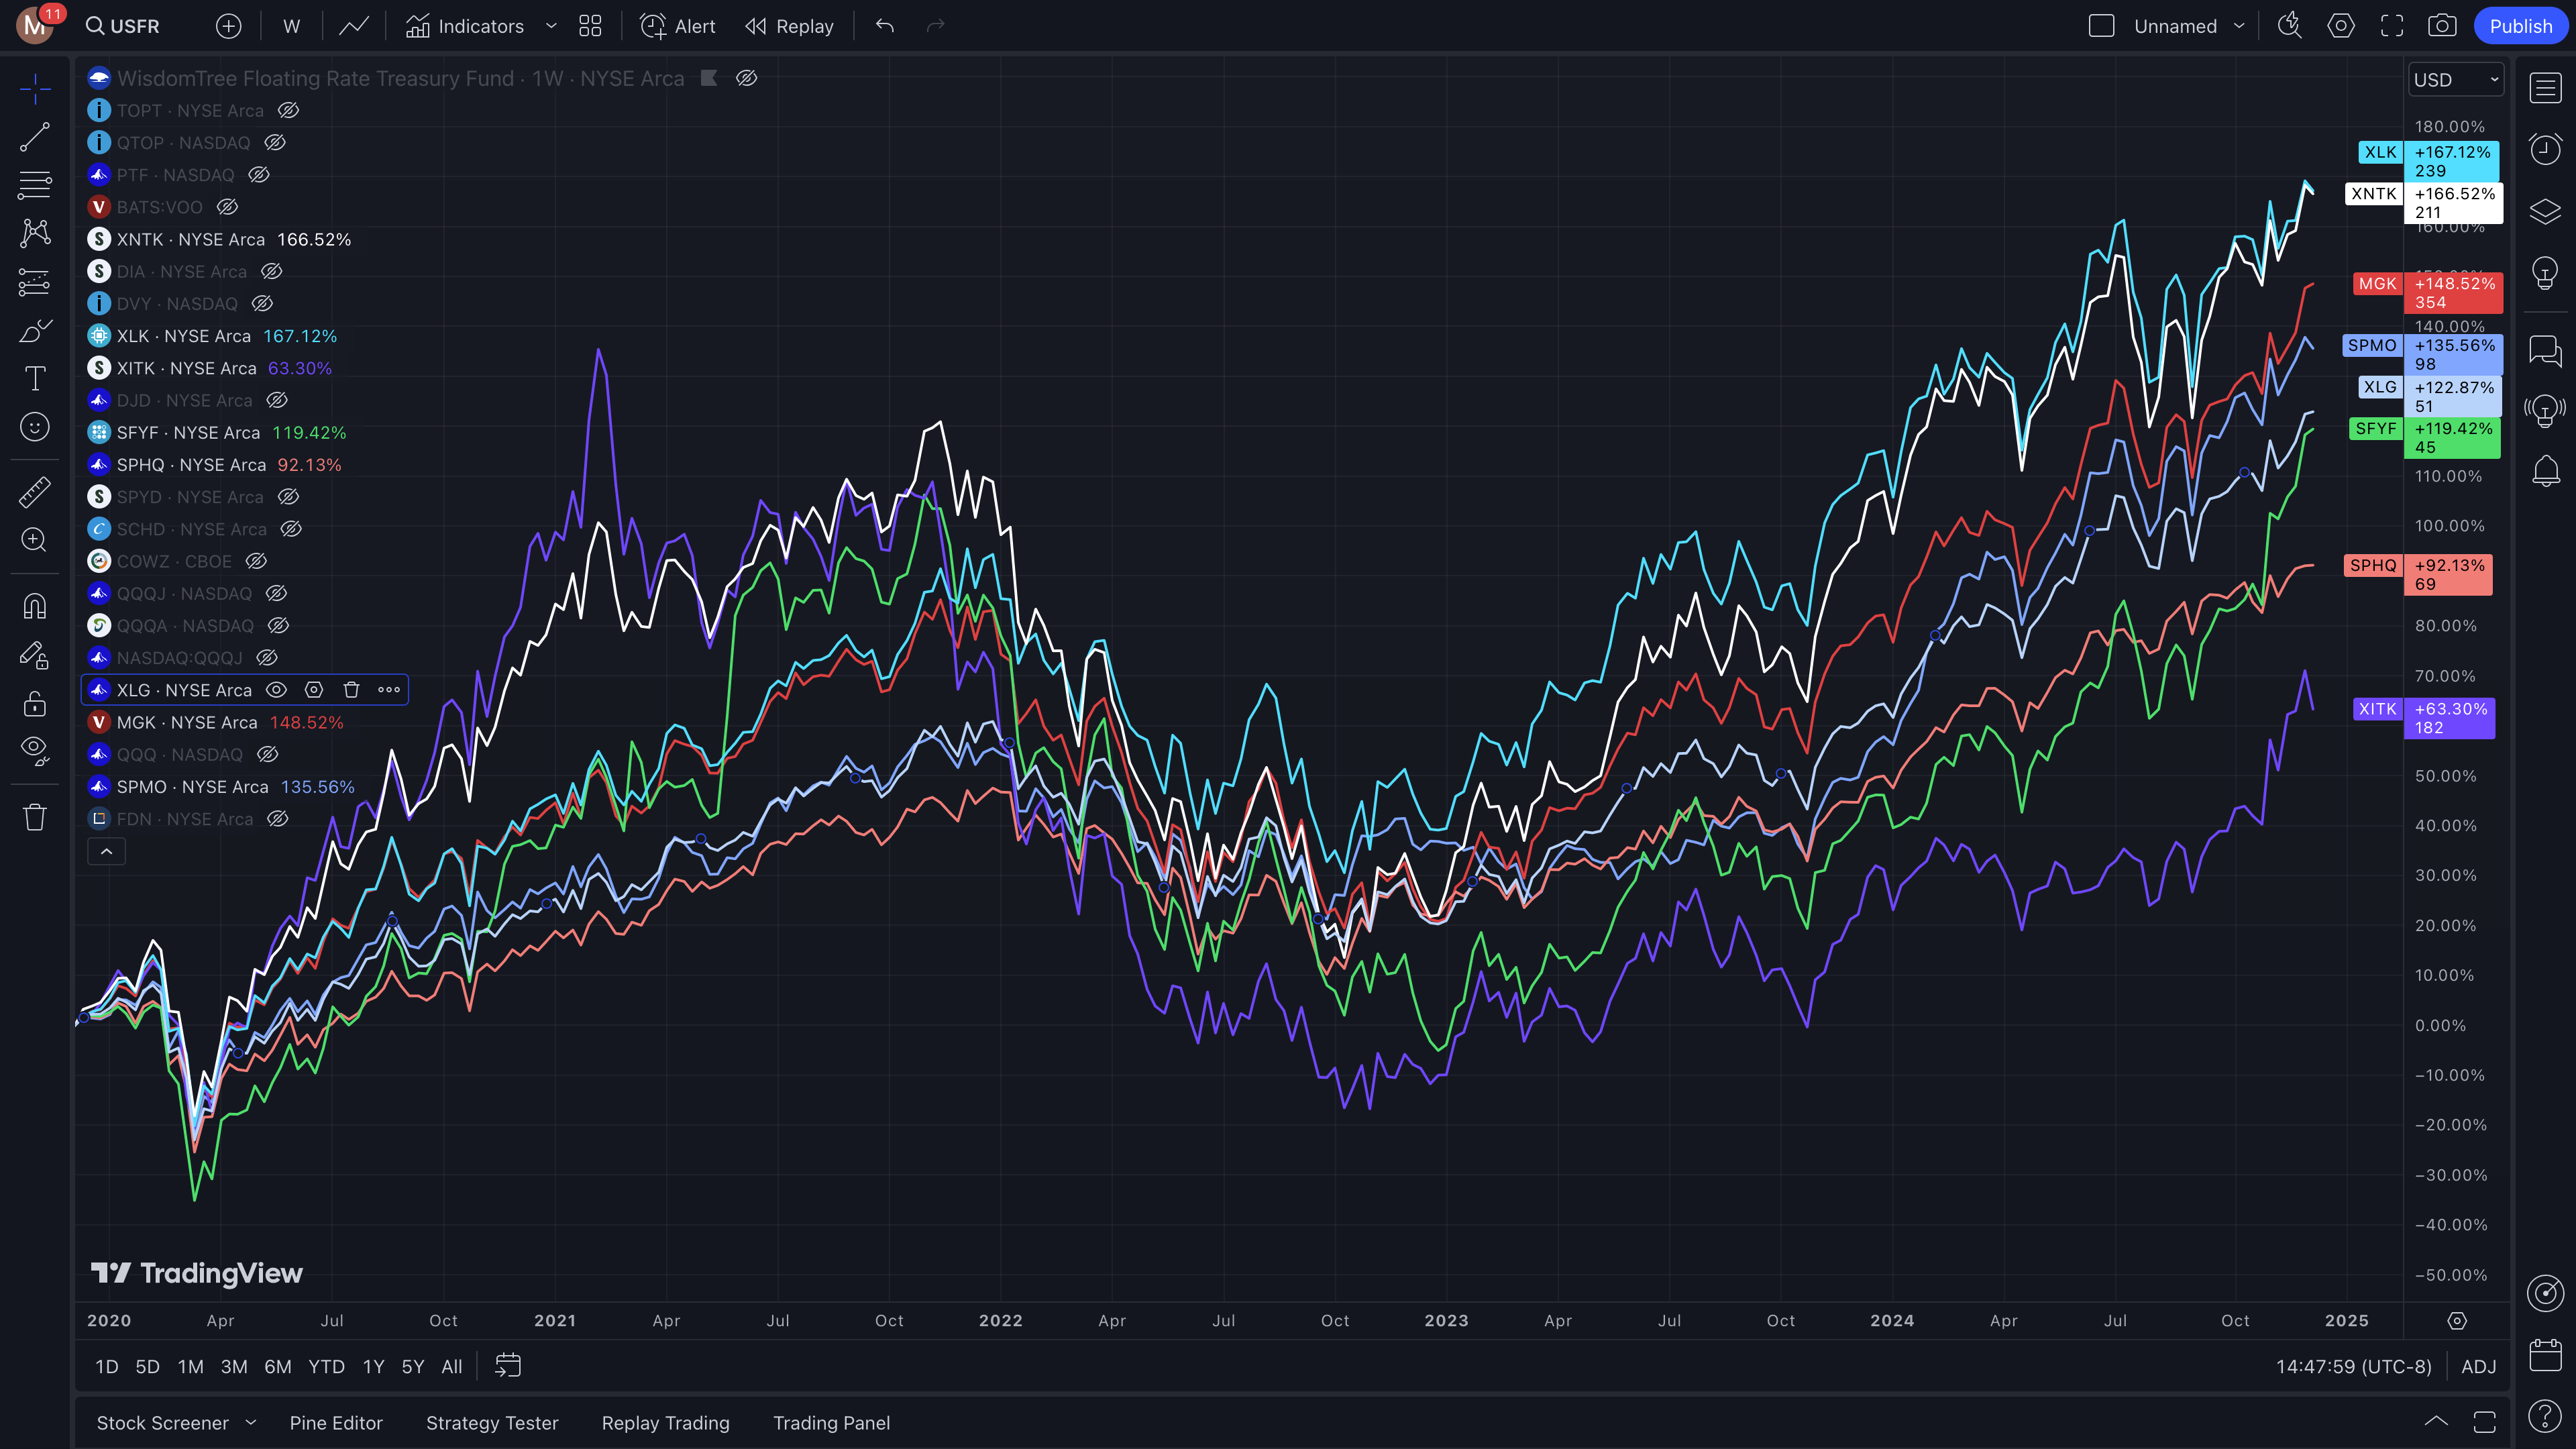
The Sofi Social 50 SFYF did somewhere in the middle performance.
The 10 year performance is show below. I am using 8 years since one of the ETFs wasn’t around then.
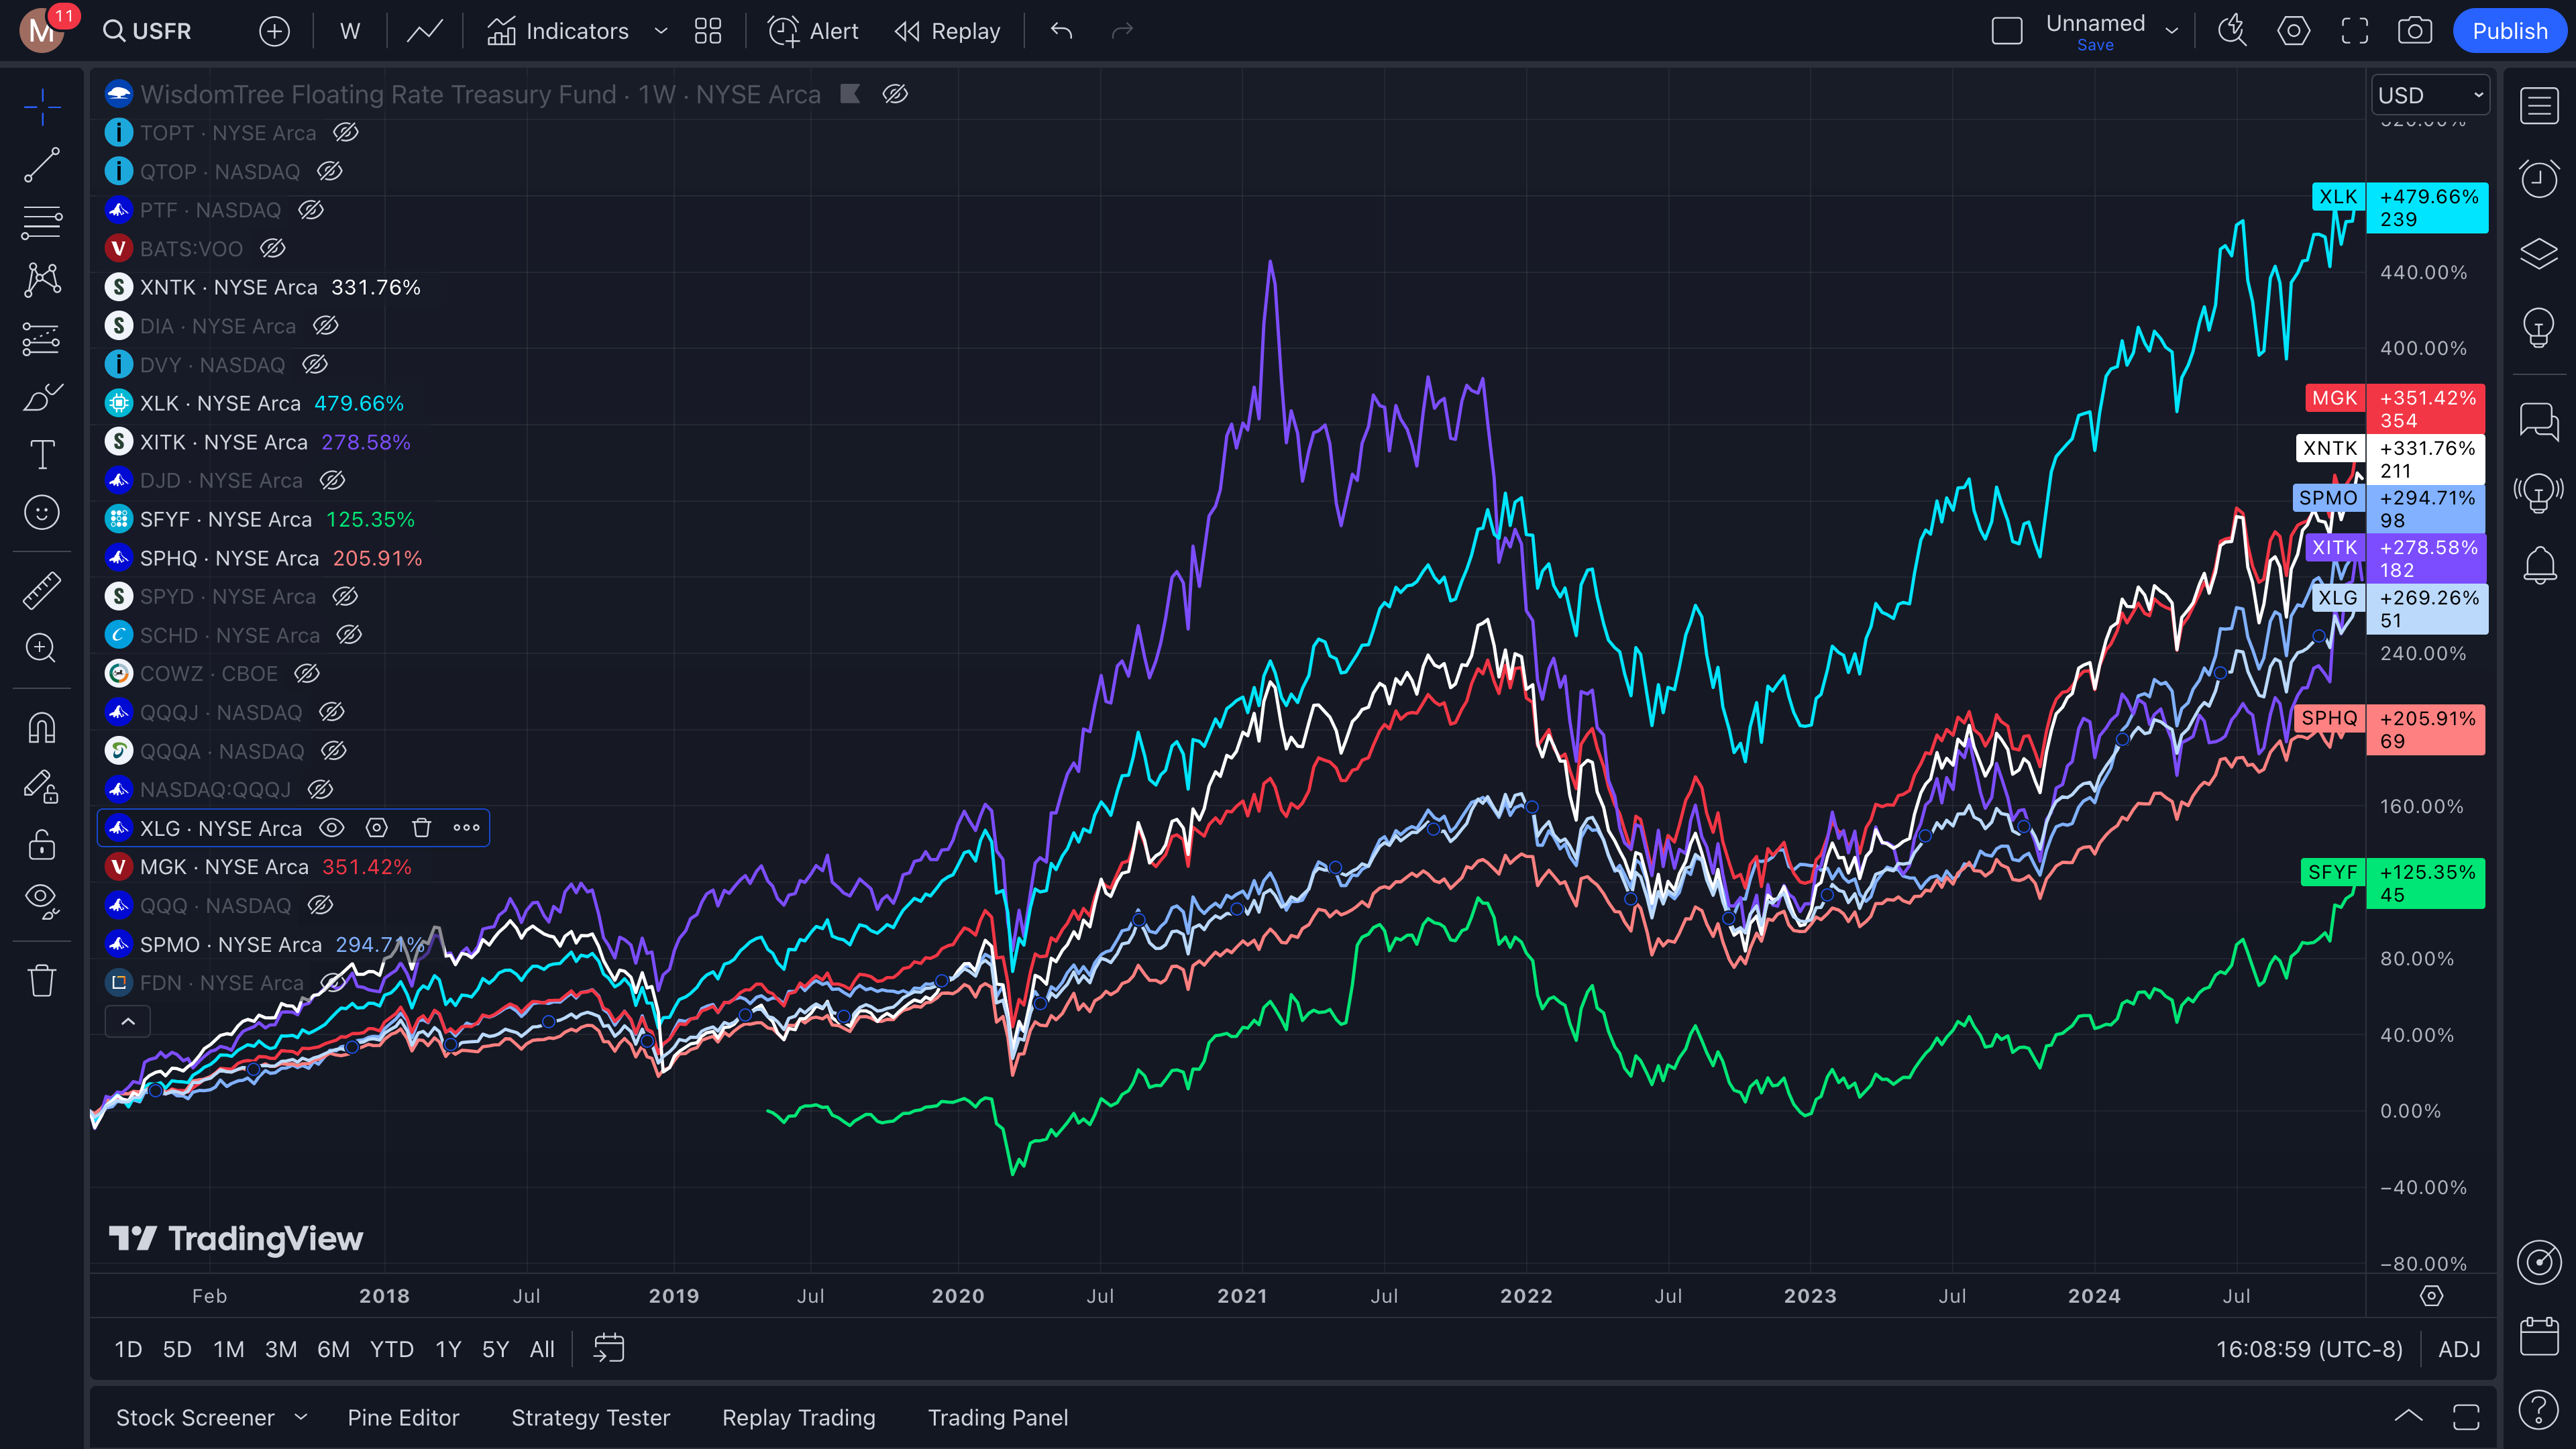
XITK‘s inception date was 2016 so that is the start point so this is about 8 years.
The performance is more or less the same as before with the tech heavy XLK, MGK and XNTK leading. The ETF with the least tech percentages were SPHQ (33%), SPMO (39%) and XLG (43%). Two of these can be seen near the bottom as some of the worst performers for this group.
Conclusion
The conclusion here is that tech has done well over the last 5 and 10 year period and having a high percentage of technology stocks in the portfolio contributes to a higher percentage return during this period shown. There were some exceptions like COWZ (21%) and SCHD (9%) which did better than their percentage of tech held.

Leave a Reply